Electric Vehicles, Adoption Timelines, and Electric Power Generation Data
OK, it's been a long, long time since I've posted up anything. Life.
But for those who care, I do track the evolution of the Electric Vehicle (EV) adoption curve. Having my own Plug-in EV for over 10 years now, I'm huge fan of EVs and I have been excited for quite a while about how wide-spread adoption will change our energy mix over the next 20+ years.
I've heard people say that EVs will help us stop drilling for oil in the US, but that ignores the near-term requirement for electricity to be generated from natural gas, which also requires drilling. With that said, there are interesting opportunities at the margin for landfill gas capture that can provide some the gas we need while reducing carbon emissions from methane.
EV Adoption
Also, I remind people that we sell about 17 million new vehicles a year in the USA. We have about 275 million registered vehicles in the country now, so even if every vehicle sold were an EV, and if every very gasoline/diesel car replaced was not re-sold to someone else, it would still take 275/17 = 16 years to replace all the internal combustion engine (ICE) vehicles on the road.
Note that US consumers bought about 300,000 EVs in each of the last couple of years, and volumes are growing rapidly (2021 may see 450,000 - 500,000). But that's still only a small single-digit percentage of annual car sales. Great trajectory, but even if that grows by 10X in the next 5 years to 5 million, it's still less than a third of sales and suggests a 20-30 year (or more) cycle to replace the majority of ICE vehicles. Mandates and legislation will surely change those numbers, but you get the idea.
There are many great sources for looking at the changes needed in the electric grid to charge the coming wave of EVs. I won't into those details right now. But my view is that charging infrastructure concerns are overblown since the vast majority of charging will happen at home, overnight. But that's a subject for another post. For now, I just want to remind people where our electricity mix is changing and how important natural gas is to our power grid, and ultimately to the EV adoption curve.
Electric Generation
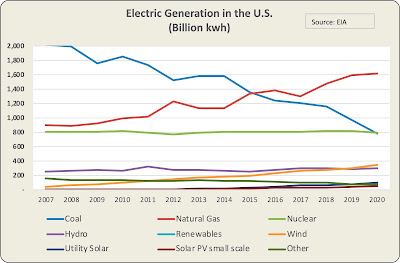
Electric generation in the US has remained relatively stable around 4,000 Billion kwh per year for 20 years. Growth in population has been offset by efficiency in appliances, HVAC, etc. It's the mix of how we generate our electricity that has changed dramatically. Coal has gone form 50% of generation to about 19% in 20 years. Abundant and cheap natural gas, driven by the boom in horizontal drilling and fractionation technology, has allowed that to happen, as gas has gone from 16% of our electric generation to over 40% in that same 20 years.
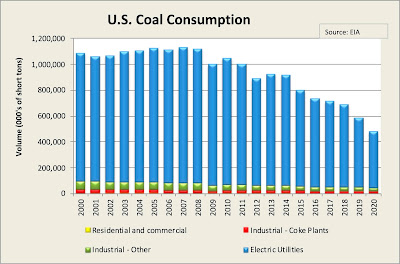
That, in turn, has allowed the US to dramatically reduce coal production and consumption.
Meanwhile, electric generation from renewable sources, primarily wind and solar, is growing rapidly, albeit still a small portion of overall electric generation.
The increase in these two sources will be significantly improved as new and better storage options become available, so that the intermittent nature of their production can be offset. But in the interim, when the wind isn't blowing and the sun isn't shining, the grid needs power plants that can easily turn on and off to deal with changes in daily power needs. Coal, Hydro, and Nuclear are not good at powering up and down quickly, so they are considered part of baseload power. Natural gas power plants are the primarily easy way to supply that intermittent / variable peak power need.
Natural Gas in US Power Production
So, natural gas used in electricity generation continues to grow. If you believe in electric vehicles, you must also believe in natural gas, at least in the near term 10-20 years. You can see below that natural gas is used in home heating and cooking (residential), as well as industrial use (chemicals), as well as in power generation.
The interesting thing about the power generation vs other uses is that the power generators are a tad less price sensitive than the industrial users. In the past, if gas prices went up, chemical companies wouldn't use it, or they'd shift production to another country with cheaper gas feedstocks. But power producers can't do that. So I'll call the next 20 years a period where higher natural gas prices (if they occur) will not necessarily cause a drop in demand as one might expect. Demand in the future will be more "sticky" than in the past, IMHO. Just as gasoline prices at the pump only marginally change buyer behavior in the short term.
Labels: alternative energy, Electric generation, EV adoption, EVs, Natural Gas consumption


