Dave's Energy

Saturday, September 18, 2021

Electric Vehicles, Adoption Timelines, and Electric Power Generation Data

 OK, it's been a long, long time since I've posted up anything. Life.

But for those who care, I do track the evolution of the Electric Vehicle (EV) adoption curve. Having my own Plug-in EV for over 10 years now, I'm huge fan of EVs and I have been excited for quite a while about how wide-spread adoption will change our energy mix over the next 20+ years. 

I've heard people say that EVs will help us stop drilling for oil in the US, but that ignores the near-term requirement for electricity to be generated from natural gas, which also requires drilling. With that said, there are interesting opportunities at the margin for landfill gas capture that can provide some the gas we need while reducing carbon emissions from methane. 

EV Adoption 

Also, I remind people that we sell about 17 million new vehicles a year in the USA. We have about 275 million registered vehicles in the country now, so even if every vehicle sold were an EV, and if every very gasoline/diesel car replaced was not re-sold to someone else, it would still take 275/17 = 16 years to replace all the internal combustion engine (ICE) vehicles on the road. 

Note that US consumers bought about 300,000 EVs in each of the last couple of years, and volumes are growing rapidly (2021 may see 450,000 - 500,000). But that's still only a small single-digit percentage of annual car sales. Great trajectory, but even if that grows by 10X in the next 5 years to 5 million, it's still less than a third of sales and suggests a 20-30 year (or more) cycle to replace the majority of ICE vehicles. Mandates and legislation will surely change those numbers, but you get the idea.


There are many great sources for looking at the changes needed in the electric grid to charge the coming wave of EVs. I won't into those details right now. But my view is that charging infrastructure concerns are overblown since the vast majority of charging will happen at home, overnight. But that's a subject for another post. For now, I just want to remind people where our electricity mix is changing and how important natural gas is to our power grid, and ultimately to the EV adoption curve.
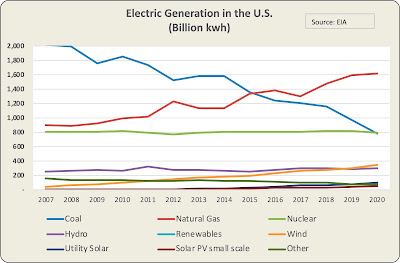
Electric Generation

Electric generation in the US has remained relatively stable around 4,000 Billion kwh per year for 20 years. Growth in population has been offset by efficiency in appliances, HVAC, etc.  It's the mix of how we generate our electricity that has changed dramatically. Coal has gone form 50% of generation to about 19% in 20 years. Abundant and cheap natural gas, driven by the boom in horizontal drilling and fractionation technology, has allowed that to happen, as gas has gone from 16% of our electric generation to over 40% in that same 20 years.


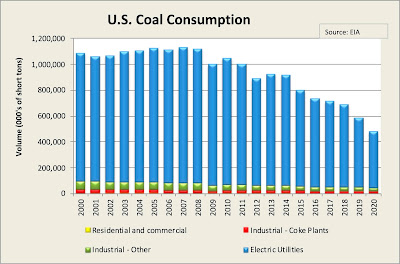
That, in turn, has allowed the US to dramatically reduce coal production and consumption.

Meanwhile, electric generation from renewable sources, primarily wind and solar, is growing rapidly, albeit still a small portion of overall electric generation.

The increase in these two sources will be significantly improved as new and better storage options become available, so that the intermittent nature of their production can be offset.  But in the interim, when the wind isn't blowing and the sun isn't shining, the grid needs power plants that can easily turn on and off to deal with changes in daily power needs. Coal, Hydro, and Nuclear are not good at powering up and down quickly, so they are considered part of baseload power. Natural gas power plants are the primarily easy way to supply that intermittent / variable peak power need.

Natural Gas in US Power Production

So, natural gas used in electricity generation continues to grow. If you believe in electric vehicles, you must also believe in natural gas, at least in the near term 10-20 years. You can see below that natural gas is used in home heating and cooking (residential), as well as industrial use (chemicals), as well as in power generation.

The interesting thing about the power generation vs other uses is that the power generators are a tad less price sensitive than the industrial users. In the past, if gas prices went up, chemical companies wouldn't use it, or they'd shift production to another country with cheaper gas feedstocks. But power producers can't do that. So I'll call the next 20 years a period where higher natural gas prices (if they occur) will not necessarily cause a drop in demand as one might expect. Demand in the future will be more "sticky" than in the past, IMHO. Just as gasoline prices at the pump only marginally change buyer behavior in the short term.


Global Natural Gas

And, of course, the US isn't the only place where natural gas use is growing. Worldwide demand is extremely strong, and gas is more difficult than crude oil to export around the world, which means it is harder to have a global price for gas.  Local demand and supply make a huge difference. The US is the largest producer ad consumer of gas, and has the largest reserves in the World. But the more we export via Liquefied Natural Gas (LNG), the more likely we will reduce the downward supply pressures the US has seen over the last 5-7 years.


China's growing spread between their ability to produce gas and their consumption has caused them to become a very important importer of gas, which has significant political and economic impacts. Also, a similar growing growing spread in China's crude oil production vs consumption was precisely what caused oil prices to spike over a several year period leading up to 2008, and which has kept continued upward pressure on oil prices for the last 20 years. This portends a similar trend for natural gas over the next 20.


Which is a long-winded way of saying that my current energy investment research efforts tend to focus on startup EV manufacturers, solar equipment manufacturers and solar farm developers, battery and storage technologies, charging and grid software management, and natural gas pipelines (existing, not new).

Conclusion

No conclusion from me, I'll let you draw your own. But I figured I'd share this in case you need any data for your next cocktail party energy discussion (everybody does that, right?  Oh, maybe that's why I don't get invited to many cocktail parties).


Labels: , , , ,

Wednesday, October 17, 2012

Stacking Oil Barrels to the Moon

As a follow-up to my prior post helping to visualize the scale of the world's daily crude oil production, I wanted to provide another "scale" eye opener I often use around the office:

So you have realized now (by reading this post on daily oil production) that we produce enough oil each day such that stacking that production in barrels would reach the moon every 5 days.  But do you really appreciate just how far away the moon is?  Let' use an example to illustrate... and here is where I usually ask someone to draw me a circle representing the Earth, then I ask for another circle representing how big the Moon is in comparison (this usually provides some good fun discussion). The typical answer I get is fairly close, something that looks like this:

In reality, the moon's diameter is about 2160 miles and Earth is about 7926 miles, so the Moon is a bit more than 1/4 the diameter of the Earth, (but it's volume is about 1/50th the Earth).  So the 2-dimensional view to the left is fairly close to correct, at least as far as relative size goes.


But then I ask this: "Can you draw me something more to scale now, showing how far the moon is away from the Earth?"  

I get all kinds of answers, many which look much like the drawing above - they don't change the distance between their drawings and might say, "probably about like that":

So I ask: "You are telling me that if I were to "flip" your flat moon over once, it is close enough that it would touch the Earth after just one flip? You are saying that the Moon is just "one moon-width" away? That usually causes them to re-draw it, maybe moving the Moon over about the distance of one or two Earth diameters.

And while that may seem a good distance, the reality is that the moon is much farther away.  At an average distance of about 238,900 miles from Earth, and with the Earth's diameter being 7,926 miles, that means the Moon is about THIRTY (30) Earth diameters away, or about ONE HUNDRED TEN (110) "Moon-diameters" away.  I then like to draw something on my white-board that looks more like this:


Sometimes my full-wall white board isn't big enough, unless I make sure I draw the initial Earth circle small enough.  Either way, I have to move across the room to finish the drawing. And then I stand back dramatically and let them absorb that and say: "That is how far away the Moon is,   and every five days we stack that much oil up. NOW do you understand just how much we produce every day in this world?.... Crazy, huh?"

Then I challenge them to find me another industry that comes even close to that..."Anyone?.... Anyone....?"

Labels: , , , , ,

Tuesday, October 16, 2012

How to Visualize What Daily Oil Production Looks Like

I get in all kinds of discussions in various venues about alternative energy. The latest Presidential debates have people talking about various alternative energies and energy independence. As I always say with alternative energy, the first thing one has to ask is "alternative to what?" If you are talking about transportation fuel (gasoline and diesel), then you are looking for an alternative to crude oil and a new way to fuel the transportation market. If you are talking about the electricity generation (power) market, that is another subject entirely. leading to how to displace coal as our top generation source (while the power sector also uses nuclear, natural gas, solar, wind, etc., coal generates close to half our electricity).

For the transportation (crude oil) sector you have heard my prior posts discuss why it is hard to displace crude oil with any ONE solution. Still, many people I talk to have a hard time understanding that many alternative solutions cannot SCALE large enough to displace oil, because realistically the amount of oil we produce every single day is so massive that it is hard for people to get their heads around it. So in order to get people to visualize just how much oil we produce every single day in the world, here's a quiz I used to like to give potential interns:

We produce and use 90 million of barrels of oil EVERY day in the world. If you stacked those barrels on top of each other, how many days of production would it take to reach the moon? 1, 10, 100, 1000?

The answer might be derived in this manner:

1) 90 milliion barrels x 3 feet (approx) height per barrel = 270 million feet tall (one days' production)

2) 270 million feet / 5280 feet per mile = 51,136 miles of production each day

3) Miles from the earth to the moon: approx 238,837 / 51,136 per day = 4.7 days

Resulting answer: about 5 days to reach the moon

So, if you want to replace oil with some liquid fuel derived from algae, corn, etc,, you have to find something that you can stack to the moon every 5 days and do that every day, all year long with no disruptions. Hard to do.

EDIT: Now you can go to my next post titled "Stacking Oil Barrels to the Moon" and see if you really appreciate just how far away the Moon really is.

Does that sound like a great deal of product? It should... Put another way: we speak about oil production in terms of barrels per day because if we talked about annual production the numbers are astronomical:

90 million barrels per day times 365 days a year equates to over 32 BILLION barrels each year (an oil barrel is 42 gallons so that is 1.3 TRILLION gallons of oil).

To yield something like that from any other naturally occurring source of energy is extremely difficult. And to top it off, those barrels of hydrocarbons are VERY energy dense. You can pack a lot of energy into a gallon of gasoline or diesel, which are very portable with today's infrastructure. Portable, dense, abundant. Hard to replicate that for now. That is why there is no ONE solution.

Which is why efficiency is the key, and electrification of the auto allows that while it diversifies the source of the power in front of the electrical plant. See my prior post titled: "The Best Alternative Fuel"

Labels: , , , , ,