Dave's Energy

Friday, October 14, 2022

Let's be Clear: The US is Producing More Oil Than Ever

I have heard WAY too many people make erroneous statements about how dependent or independent the US is on foreign oil. So let's be extremely clear: the US is producing more crude oil than it ever has in its history, dating back to the 1920s. The US is importing less crude oil than ever. We are less dependent than we have ever been. We are, in fact, a net exporter of crude oil and products. And PLEASE don't try to make this about democrats vs republicans. It isn't political. I'm not a political analyst and I have no axe to grind. Democrats have not ruined the industry and Republicans haven't helped it in any meaningful way.

It's the oil industry doing what it does: producing oil if it is economically viable to do so. We had the largest growth in oil production in the history of the US starting in 2008 through 2020, most of which time there was a Democrat in the White House. The oil industry developed new ways to extract oil (horizontal drilling and fractionation). It's not due to policies or subsidies or political ideologies. It's ingenuity and technology and capitalism. Also please note that less than 10% of US land drilling occurs on Federal lands. So when politicians say they want to restrict drilling on Federal leases, the oil companies just drill more on private lands and State lands. Those kind of policies and statements are meaningful, but not as much as people want to believe. It's a red herring: politicians on both sides pandering to their bases.

Again: we are making more oil than ever (taking out COVID impact), and importing less than ever. In fact, we are a NET exporter of petroleum products. "WHAT?" you say? Yes, because although we may import a couple millions barrels of crude oil, we export about 4 million of products we refine from the crude. Because we have refineries that can do it. So we are a net exporter of petroleum, and that has been a huge boon to our economy and massively helping our trade balance.

Just look at the data compiled every year by the US Energy Information Administration. Here is production of crude oil back to 1920 (link included for raw data):

EIA Data: US Field Production of Crude Oil


And here you see our Net Imports of Crude oil and products. This represents anything we import minus anything we export. In 2018, we became a net exporter for the first time in history, and we continue to improve.  The biggest improvement came from 2006 through 2018.

EIA data: Net Imports of Crude Oil and Products

Meanwhile, our consumption stays pretty flat. Even with a growing economy and more cars, we have. Here is data from the 2022 BP Statistical Review of World Energy, which does not take into account the net exports of products. But you see that we are now energy independent compared to any time in modern history. Consumption of about 18 million barrels per day still makes us the largest consumer of crude oil. But we are also now the largest producer, far surpassing Saudi Arabia.  Thank the many small and independent oil companies, not "big oil" and certainly not the politicians.


So, next time someone comments about the US becoming more dependent on foreign oil, point them to this page. And don't let people get way with "I heard we now are more dependent than ever". I've heard that statement and it is patently ridiculous. Be informed, and be well, my friends!

Labels: , , , , , ,

Thursday, August 18, 2022

Natural Gas: Why Care right now?

In my last post, I discussed the timeline for electric vehicle (EV) adoption and the need for natural gas as a fuel that enables the transition from an oil-based transportation economy to an electric-based one. To reiterate: I'm a believer in the future of EVs: I own one EV and have another on order. But I'm also a realist, with my own decisions being driven by data and science. 

So I restate this from the prior post: we will need natural gas as a "lesser of evils" fossil fuel for the next 10 years (at least), and realistically much longer. But you only have to believe me for the next 5 years to understand my thesis on why we are in a multi-year bull market for companies that produce natural gas.  

Key summary points:

1) Natural gas is the most dominant component of electric production in the US

2) If you believe in EV adoption, you can't wish away natural gas drilling (see prior post Titled "Electric Vehicles, Adoption Timelines, and Electric Power Generation"

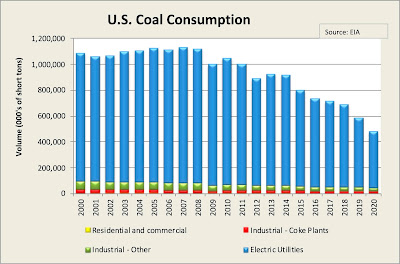
3) Natural gas has been and will continue to be a key fuel to reduce our need to burn coal, which is still almost 20% of electric generation in the US, and coal is by far the biggest carbon emitter in the portfolio of US electric generation assets 

4) As renewables like Solar and Wind grow as a proportion our electric generation, natural gas plants are often needed as backup generation due to the intermittent nature of the renewables

5) The USA is the largest producer of natural gas in the world 

6) Natural gas (at large scale) in the USA is cheaper than almost anywhere in the world 

7) Natural gas production companies have reduced drilling activity significantly in the last 10 years. They have had little incentive to grow as low prices have existed for over 5 years.

8) We over-produce gas in summer (and store it) and then use the storage in winter, because demand in winter exceeds daily production capacity. Right now, natural gas in storage is the lowest we have ever seen in summer for many years: partly due to long-term increased demand from electric generation and partly due to seasonal peak demand increases during this hot summer. 

9) With low inventories and winter coming, it looks like we won't fill storage to what we need in order to have enough excess gas in winter.

10) Natural gas prices on the spot market in August are higher than they have been in many years, encouraging more production, but new drilling isn't increasing fast enough. The drillers are very cautious as they've been through many boom and bust cycles.

11) The US is drastically increasing its ability to export more natural gas to places like Asia and Europe, where prices are far higher. This is not a new phenomenon, it's been gaining speed for years due to natural gas prices in the US being close to $2 per million cubic feet (MCF) for several while they are over $15 to $30 per MCF in other parts of the world

12) Looking at the companies that drill for a produce natural gas, most are valued as if gas is still $3-$4, even though it's over $9 on the spot market and likely to remain high (over $5-6) for this year and years to come.

13) If you're interested in these companies, look at SWN, EQT, RRC, DVN, CRK, CHK, and others. They tend to get traded like oil companies, even though most of them produce mainly natural gas, not crude oil.

So, that's the summary, here is some data on those various points:

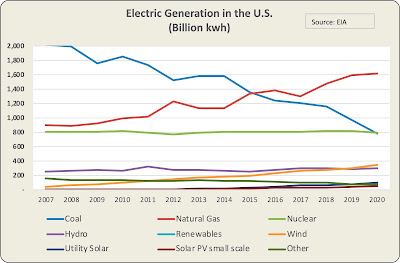
Gas for electricity: As discussed in the prior post, electric generation in the US has significantly changed in the last 20 years. Natural gas has displaced coal, with gas now powering about 40% of the grid,  while nuclear has stayed steady around 20% and renewables have grown from virtually nothing to a total of about 13%. Coal has dropped from a whopping 50% just 20 years ago to about 15% today. As electric demand increases, so will the need for natural gas AND renewables, to meet growth as well as to displace coal.


Largest Producer: US has a strategic and technical advantage in natural gas: The US produces more natural gas than anyone on the world, and we have the world's largest reserves. This partly due to the nature of the underlying geology of the US and in large part due to the technology that the US has developed for horizontal drilling and fractionation of reservoirs with "tight" rock, including shale-based oil and gas.


Worldwide gas demand increasing: As the world grows, and as it needs more power from sources other than coal and renewables, gas is the preferred source. Worldwide demand has grown 66% in the last 20 years, while China's demand has grown 1370% in the same period. Europe has grown as well, by depending on supplies from places like Russia and Ukraine, which have recently proven to be a strategic mistake for Europe.


Exports from the US are expanding: Gas is not as easy to move around the world as oil is. For long-distance transport, it must be liquefied using an expensive process in large LNG (liquefied Natural Gas) plants. It must then be transported in special LNG ships, and re-gassified in more expensive plants at the point of import. That infrastructure builds slowly but has helped increase exports from the US, and will continue to grow, bring the US abundance of gas to countries that desperately need it. At the time I write this, natural gas in Europe and China is roughly 4 to 8 times more expensive than in the US. The world needs our exports. The chart below shows the growth recently, and keep in mind that this was before the Russian invasion of Ukraine.


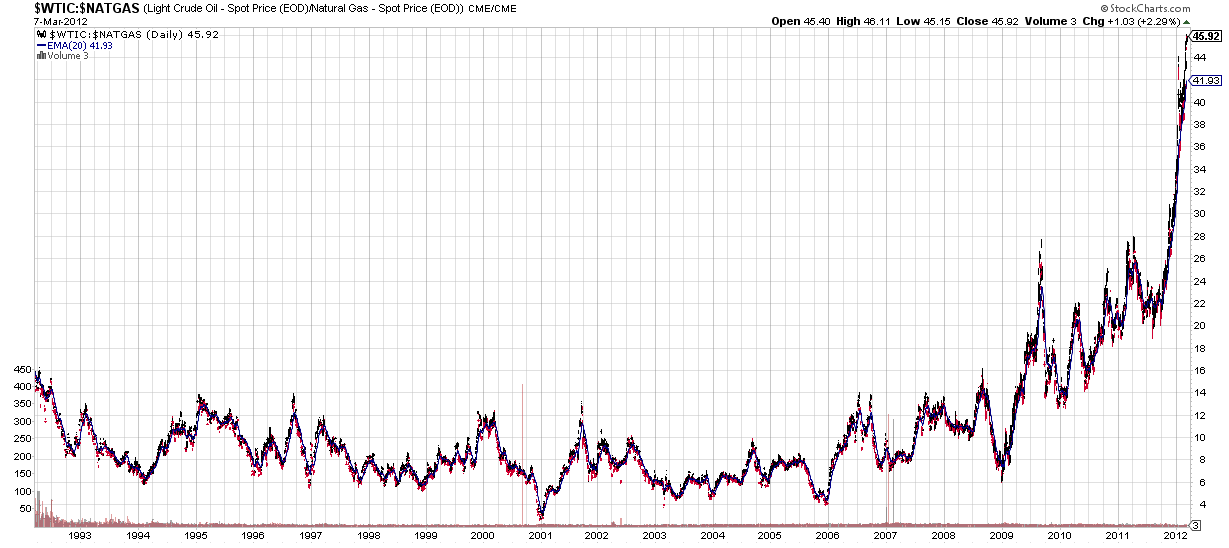
Drilling is constrained: US oil and gas production companies have significantly reduced the number of drilling rigs deployed in the US looking for gas. Prices have been low for many years, hovering under $2 per MCF for long enough that many producers went bankrupt or had to restructure. Companies are now more debt-averse and less likely to "drill, baby, drill" as prices rise. In 2008, at the last big spike in prices, companies had over 1500 rigs drilling for natural gas (see red line below). That number has now been under 200 rigs for the last 7 years and hasn't increased dramatically since prices started rising a year ago. Yet production stays high: how? That is because the average rig today drills better wells than 10 and 20 years ago (and no dry holes - virtually all wells are successful). Today's large onshore wells can produce 20,000 - 30,000+ MCF a day at initial production, compared to 2,000 to 5,000 just 10 years ago. Technology advancements and frac improvements account for the massive increases in productivity. So, 30-50 extra rigs now make a big difference. 


Storage is extremely low: Natural gas demand is higher in winter, historically, than in summer. We traditionally store gas in summer and use that excess in winter, which generally leads to higher prices in winter than in summer. But with more gas being used for electricity in summer (more electricity from gas now than ever, more houses with air conditioning), summer demand has increased, making it harder to fill gas in summer, unless prices stay high to encourage more supply. So far in summer 2022, prices have been very high and yet demand is still high and supply isn't enough to fill gas storage. Our storage is at an extremely low level and isn't filling fast enough to ensure proper excess for Winter.  The chart below shows the storage amount today of about 2400 Billion cubic feet. Compare that red line to where we were the last few years and you will see why summer gas prices remain high. We are struggling to fill inventory for Winter.


Prices are high: Spot gas prices have risen from $3.75 per MCF last year at this time to over $9.00 per MCF today. That is the highest summer gas price we've seen since 2008, just before the financial crisis, and in 2005 when Hurricanes in the Gulf of Mexico destroyed or hampered a large amount of US offshore natural gas production. Note the yellow shaded areas below. Those are the Winter price spikes that occur when we have cold Winter snaps and the country needs more gas to heat homes. If the gas can't get there through the pipelines fast enough, prices rise. 2021 was unusual, with significant pipeline issues in Texas. 


                   August Price     Winter Spike
2016                 $2.75          $3.60   
2017                 $2.90               $6.20
2018                 $2.77               $4.50
2019                 $2.19               $2.60    (warm winter, high storage, no big spike)
2020                 $1.80             $23.86    (Texas freeze issues)
2021                 $3.93              $6.70
2022                 $9.20              $ ??    


Given that August prices are currently in the $9.00/MCF range (3 to 4x normal), and that natural gas futures are trading above $9 for all months September through January, there is a very real potential for sustained high prices all throughout winter. 

Why you might like natural gas stocks: Most Wall Street Analysts are using natural gas prices of between $4.50 and $5.00 for generating estimates for fiscal 2023. So earnings per share (EPS) estimates for most of the companies that produce gas are significantly under-estimated at this point. Estimates will likely continue to be increased as the months move along, creating a tailwind for the stocks of these companies.  Looking back at the last 12 months (4 quarters) of earnings shows that these companies are, in many cases, trading at price/earnings (P/E ratios) of about 3x to 10x. 

Take a look at companies like Chesapeake Energy (CHK), Devon Energy (DVN), Range Resources (RRC), Southwestern Energy (SWN), Equitable (EQT), and Comstock Resources (CRK). I'm not suggesting you buy any of them, but note that these are often traded as if they primarily produce oil (they tend to run up and down with the energy ETF trading), and yet these are companies focused primarily on natural gas and the natural gas liquids derived from them (propane and ethane, for example). Most are trading as if gas is $4.50 and they are being afforded a low P/E ratio for valuation. I think many investors see the current natural gas situation as short-term and based on things like Ukraine. I think I've made the case above that there is much more going on here.

Chesapeake Energy, for example, had $4.87 in EPS in Q2 and $3.09 in Q1 and analysts expect the company will generate $15.00 in EPS in 2022. Selling at $100 per share, the company is trading at about six times earnings (P/E ratio of 6), and that is having sold gas at an average price well below where prices are today. Next year' earnings are expected to bin in the range of $19 per share (average analyst expectations) which are generally using prices under $5.00 or $6.00 per mcf to establish those estimates. Also note that these company's earnings can look more volatile than the really are, due to some terrible accounting rules dealing with commodity hedging (see my old post called "Hedge Accounting is Distorting the Reality of Oil and Gas Earnings".

CHK is just one example, but the whole group has shown to be throwing off tremendous free cash flow and they have all been focused on returning capital to shareholders through buybacks and dividends. They are also focused more on ESG initiatives, being better stewards of the environment, and significantly reducing methane emissions from operations. All which must happen. Because for now, we need gas. These companies have changed their stripes and are not pouring everything back into drilling, which can often lead to destruction of shareholder value when prices inevitably decline.  And they do.

I have always said: that "the cure for high prices is... high prices. And the cure for low prices is... low prices". Demand and supply just take a while to get back to equilibrium.  For me, I'm suggesting that equilibrium is going to take several years, based on the data presented above. Winter is coming.


Labels: , , , , , , , ,

Saturday, September 18, 2021

Electric Vehicles, Adoption Timelines, and Electric Power Generation Data

 OK, it's been a long, long time since I've posted up anything. Life.

But for those who care, I do track the evolution of the Electric Vehicle (EV) adoption curve. Having my own Plug-in EV for over 10 years now, I'm huge fan of EVs and I have been excited for quite a while about how wide-spread adoption will change our energy mix over the next 20+ years. 

I've heard people say that EVs will help us stop drilling for oil in the US, but that ignores the near-term requirement for electricity to be generated from natural gas, which also requires drilling. With that said, there are interesting opportunities at the margin for landfill gas capture that can provide some the gas we need while reducing carbon emissions from methane. 

EV Adoption 

Also, I remind people that we sell about 17 million new vehicles a year in the USA. We have about 275 million registered vehicles in the country now, so even if every vehicle sold were an EV, and if every very gasoline/diesel car replaced was not re-sold to someone else, it would still take 275/17 = 16 years to replace all the internal combustion engine (ICE) vehicles on the road. 

Note that US consumers bought about 300,000 EVs in each of the last couple of years, and volumes are growing rapidly (2021 may see 450,000 - 500,000). But that's still only a small single-digit percentage of annual car sales. Great trajectory, but even if that grows by 10X in the next 5 years to 5 million, it's still less than a third of sales and suggests a 20-30 year (or more) cycle to replace the majority of ICE vehicles. Mandates and legislation will surely change those numbers, but you get the idea.


There are many great sources for looking at the changes needed in the electric grid to charge the coming wave of EVs. I won't into those details right now. But my view is that charging infrastructure concerns are overblown since the vast majority of charging will happen at home, overnight. But that's a subject for another post. For now, I just want to remind people where our electricity mix is changing and how important natural gas is to our power grid, and ultimately to the EV adoption curve.

Electric Generation

Electric generation in the US has remained relatively stable around 4,000 Billion kwh per year for 20 years. Growth in population has been offset by efficiency in appliances, HVAC, etc.  It's the mix of how we generate our electricity that has changed dramatically. Coal has gone form 50% of generation to about 19% in 20 years. Abundant and cheap natural gas, driven by the boom in horizontal drilling and fractionation technology, has allowed that to happen, as gas has gone from 16% of our electric generation to over 40% in that same 20 years.


That, in turn, has allowed the US to dramatically reduce coal production and consumption.

Meanwhile, electric generation from renewable sources, primarily wind and solar, is growing rapidly, albeit still a small portion of overall electric generation.

The increase in these two sources will be significantly improved as new and better storage options become available, so that the intermittent nature of their production can be offset.  But in the interim, when the wind isn't blowing and the sun isn't shining, the grid needs power plants that can easily turn on and off to deal with changes in daily power needs. Coal, Hydro, and Nuclear are not good at powering up and down quickly, so they are considered part of baseload power. Natural gas power plants are the primarily easy way to supply that intermittent / variable peak power need.

Natural Gas in US Power Production

So, natural gas used in electricity generation continues to grow. If you believe in electric vehicles, you must also believe in natural gas, at least in the near term 10-20 years. You can see below that natural gas is used in home heating and cooking (residential), as well as industrial use (chemicals), as well as in power generation.

The interesting thing about the power generation vs other uses is that the power generators are a tad less price sensitive than the industrial users. In the past, if gas prices went up, chemical companies wouldn't use it, or they'd shift production to another country with cheaper gas feedstocks. But power producers can't do that. So I'll call the next 20 years a period where higher natural gas prices (if they occur) will not necessarily cause a drop in demand as one might expect. Demand in the future will be more "sticky" than in the past, IMHO. Just as gasoline prices at the pump only marginally change buyer behavior in the short term.


Global Natural Gas

And, of course, the US isn't the only place where natural gas use is growing. Worldwide demand is extremely strong, and gas is more difficult than crude oil to export around the world, which means it is harder to have a global price for gas.  Local demand and supply make a huge difference. The US is the largest producer ad consumer of gas, and has the largest reserves in the World. But the more we export via Liquefied Natural Gas (LNG), the more likely we will reduce the downward supply pressures the US has seen over the last 5-7 years.


China's growing spread between their ability to produce gas and their consumption has caused them to become a very important importer of gas, which has significant political and economic impacts. Also, a similar growing growing spread in China's crude oil production vs consumption was precisely what caused oil prices to spike over a several year period leading up to 2008, and which has kept continued upward pressure on oil prices for the last 20 years. This portends a similar trend for natural gas over the next 20.


Which is a long-winded way of saying that my current energy investment research efforts tend to focus on startup EV manufacturers, solar equipment manufacturers and solar farm developers, battery and storage technologies, charging and grid software management, and natural gas pipelines (existing, not new).

Conclusion

No conclusion from me, I'll let you draw your own. But I figured I'd share this in case you need any data for your next cocktail party energy discussion (everybody does that, right?  Oh, maybe that's why I don't get invited to many cocktail parties).


Labels: , , , ,

Wednesday, October 17, 2012

Stacking Oil Barrels to the Moon

As a follow-up to my prior post helping to visualize the scale of the world's daily crude oil production, I wanted to provide another "scale" eye opener I often use around the office:

So you have realized now (by reading this post on daily oil production) that we produce enough oil each day such that stacking that production in barrels would reach the moon every 5 days.  But do you really appreciate just how far away the moon is?  Let' use an example to illustrate... and here is where I usually ask someone to draw me a circle representing the Earth, then I ask for another circle representing how big the Moon is in comparison (this usually provides some good fun discussion). The typical answer I get is fairly close, something that looks like this:

In reality, the moon's diameter is about 2160 miles and Earth is about 7926 miles, so the Moon is a bit more than 1/4 the diameter of the Earth, (but it's volume is about 1/50th the Earth).  So the 2-dimensional view to the left is fairly close to correct, at least as far as relative size goes.


But then I ask this: "Can you draw me something more to scale now, showing how far the moon is away from the Earth?"  

I get all kinds of answers, many which look much like the drawing above - they don't change the distance between their drawings and might say, "probably about like that":

So I ask: "You are telling me that if I were to "flip" your flat moon over once, it is close enough that it would touch the Earth after just one flip? You are saying that the Moon is just "one moon-width" away? That usually causes them to re-draw it, maybe moving the Moon over about the distance of one or two Earth diameters.

And while that may seem a good distance, the reality is that the moon is much farther away.  At an average distance of about 238,900 miles from Earth, and with the Earth's diameter being 7,926 miles, that means the Moon is about THIRTY (30) Earth diameters away, or about ONE HUNDRED TEN (110) "Moon-diameters" away.  I then like to draw something on my white-board that looks more like this:


Sometimes my full-wall white board isn't big enough, unless I make sure I draw the initial Earth circle small enough.  Either way, I have to move across the room to finish the drawing. And then I stand back dramatically and let them absorb that and say: "That is how far away the Moon is,   and every five days we stack that much oil up. NOW do you understand just how much we produce every day in this world?.... Crazy, huh?"

Then I challenge them to find me another industry that comes even close to that..."Anyone?.... Anyone....?"

Labels: , , , , ,

Tuesday, October 16, 2012

How to Visualize What Daily Oil Production Looks Like

I get in all kinds of discussions in various venues about alternative energy. The latest Presidential debates have people talking about various alternative energies and energy independence. As I always say with alternative energy, the first thing one has to ask is "alternative to what?" If you are talking about transportation fuel (gasoline and diesel), then you are looking for an alternative to crude oil and a new way to fuel the transportation market. If you are talking about the electricity generation (power) market, that is another subject entirely. leading to how to displace coal as our top generation source (while the power sector also uses nuclear, natural gas, solar, wind, etc., coal generates close to half our electricity).

For the transportation (crude oil) sector you have heard my prior posts discuss why it is hard to displace crude oil with any ONE solution. Still, many people I talk to have a hard time understanding that many alternative solutions cannot SCALE large enough to displace oil, because realistically the amount of oil we produce every single day is so massive that it is hard for people to get their heads around it. So in order to get people to visualize just how much oil we produce every single day in the world, here's a quiz I used to like to give potential interns:

We produce and use 90 million of barrels of oil EVERY day in the world. If you stacked those barrels on top of each other, how many days of production would it take to reach the moon? 1, 10, 100, 1000?

The answer might be derived in this manner:

1) 90 milliion barrels x 3 feet (approx) height per barrel = 270 million feet tall (one days' production)

2) 270 million feet / 5280 feet per mile = 51,136 miles of production each day

3) Miles from the earth to the moon: approx 238,837 / 51,136 per day = 4.7 days

Resulting answer: about 5 days to reach the moon

So, if you want to replace oil with some liquid fuel derived from algae, corn, etc,, you have to find something that you can stack to the moon every 5 days and do that every day, all year long with no disruptions. Hard to do.

EDIT: Now you can go to my next post titled "Stacking Oil Barrels to the Moon" and see if you really appreciate just how far away the Moon really is.

Does that sound like a great deal of product? It should... Put another way: we speak about oil production in terms of barrels per day because if we talked about annual production the numbers are astronomical:

90 million barrels per day times 365 days a year equates to over 32 BILLION barrels each year (an oil barrel is 42 gallons so that is 1.3 TRILLION gallons of oil).

To yield something like that from any other naturally occurring source of energy is extremely difficult. And to top it off, those barrels of hydrocarbons are VERY energy dense. You can pack a lot of energy into a gallon of gasoline or diesel, which are very portable with today's infrastructure. Portable, dense, abundant. Hard to replicate that for now. That is why there is no ONE solution.

Which is why efficiency is the key, and electrification of the auto allows that while it diversifies the source of the power in front of the electrical plant. See my prior post titled: "The Best Alternative Fuel"

Labels: , , , , ,

Saturday, July 28, 2012

What the politicians and media call "Big Oil Subsidies"

I am so very tired of political misinformation. Mostly, I brush it off as easy to spot, figuring that the more enlightened citizens out there will recognize BS for what it is. But that doesn't seem to be the case when it comes to oil companies. And this rampant BS is especially prevalent in election years! People want to believe any lie that is thrown out there.

Case in point: My brother Jeff is as intelligent, educated, and logical as any man as you'll ever meet. Yet even he fell victim to the perpetual lie about oil company "subsidies". He recently said something to me like: "I really don't see why the big oil companies should get special tax breaks that others don't get". I realized then that the lies are so deeply ingrained in our collective minds that I may never change anyone's mind. Yet, I did manage to sway my brother once he was informed of the real facts. So while this may be an uphill climb, I will embark on an adventure here and try really hard to give the basic facts to help some of you realize that the big oil companies don't get huge "special breaks".

 First off, for the short cheat-sheet version of my story, I will point out two key items:

1) The "subsidies" many politicians and media types like to talk about are what every other industry calls deductions for "Cost of Goods Sold". Removing those so-called "subsidies" for the oil business is like saying that car companies can't deduct the cost of steel or labor.

2) The Oil Industry is the second largest taxpayer in the U.S., right after the financial institution sector (another hated industry!)

OK, more detail:

"TAX BREAKS"
If you search the internet for "oil company tax subsidies", you will see the same type of data thrown out over and over "oil companies enjoy huge tax breaks and are big lobbyists". First off, those two statements are intentionally inflammatory and purposefully vague in their connection. But moving beyond that, you often see a few data items thrown about, such as: "$24 Billion dollars in tax breaks" that Senators were debating earlier in 2012. They also like to say things about the massive profits these companies make (they don't tell you, however,that those massive profits are in fact, AFTER taxes are paid).

For now, let's focus on these "tax breaks" that every media outlet quotes...where they tend to perpetuate each other's numbers and make them seem valid merely by virtue of repetition. Typical of the hyperbole is what you'll find on the website of Senator Robert Menendez (NJ).  The $24 BILLION dollars in "tax breaks" that Senator Menendez was railing against in his "Repeal Big Oil Tax Subsidies Act" are in fact the COSTs of drilling wells and the Depreciation (depletion) expense that is deducted when each unit of production is sold.

 For specific wording of what Sen. Menendez was trying to repeal, read the actual Act at the Library of Congress:
http://thomas.loc.gov/cgi-bin/bdquery/z?d112:SN02204:@@@D&summ2=m& 

Where it says the intent of the law: "Limits or repeals certain tax benefits for major integrated oil companies 
(1) the foreign tax credit; 
(2) the tax deduction for income attributable to oil, natural gas, or primary products thereof; 
(3) the tax deduction for intangible drilling and development costs; 
(4) the percentage depletion allowance for oil and gas wells; 
(5) the tax deduction for qualified tertiary injectant expenses. 

Number one should be obvious. If you paid tax on income in another country, the IRS generally lets you deduct that as a business expense. Every industry gets this, so taking this away is not repealing a "special tax break". It's merely allowing for double taxation on the oil companies. Why? Because in the minds of the Bill's authors- they can afford it!

Number two, three and four are tax deductions for expenses incurred in developing and producing oil and gas. For example, "intangible drilling costs" include those items that do NOT get capitalized on the balance sheet as an asset when drilling a well. These are items that get expensed during the process, such as LABOR, MATERIALS, and ENGINEERING. Yeah, those are costs of doing business. Allowing for their deduction isn't a special break, it merely has a different name than the accounting books of a retailer, for example. Calling that a special break would imply that a deducting the labor costs for Starbucks' counter employees is a "special tax break" for Starbucks. In the case of the oil companies, these are the core expenses for producing oil and gas. "Percentage" depletion" is what other industries call "depreciation"  It is the loss of value by virtue of something being produced. In the case of an oil company, that depletion "expense" is the delayed recognition of the costs  that WERE capitalized on the balance sheet when drilling a well (apologies to non-accounting types, but when I say they were "capitalized", that means they were not taken as a deduction at that time, but instead were listed as an asset - there was no tax shield at the time they incurred those costs).  In other words, those were any costs that were not deducted at the time as "intangible".  The oil company is recognizing the costs that were spent to create the well, and taking that deduction on a per-unit basis as they produce each unit of oil or natural gas.  Bottom line: these are actual costs, nothing fancy.  They either deduct them at the time incurred or later when the units of oil are produced.

Number five is a special sub-category of the others - it sounds like some special deal, but "tertiary injectant" merely means the company is injecting something into the ground to cause more oil or gas to be produced. Tertiary is the stage of production after "primary" (when oil flows freely by virtue of its own pressure), "Secondary" (when things like pumps are used to bring the oil to the surface), then "tertiary" (when they use any esoteric means they can to get more oil out). Squeezing out the last of an already-discovered field is called being efficient, and the government should encourage doing so. Taking away a basic cost deduction would be folly and could encourage the abandonment of otherwise productive fields. Another subject, different day: I love how these politicians act as if taking away these "subsidies" would somehow make YOUR gasoline costs go down. Quite the opposite.

In the car industry, should we ignore the cost of labor to build the car, the cost of steel, and the depreciation on the capital equipment (the factory) that the company uses to build the cars? Of course not!! What you would end up with is essentially a "revenue tax", not an income tax.

Oil Company Taxes Paid 

 A few years ago, I wrote this blog post, entitled:
Energy companies pay the most taxes amongst the S&P500 

Where I presented this data (note that these numbers are in millions, so that number below is 90 Billion in cash taxes for the oil companies in 2008, fully 30% of all cash taxes paid by the S&P500 companies.):
The data has changed a bit, but all the relationships stay the same in 2009-2011. Energy companies pay some of the largest absolute amounts of taxes, and at a higher RATE, even after "deductions and subsidies" than almost any other industry.

So next time someone tells you that big oil companies get "special tax breaks", ask them which tax break they are referring to. Then ask them what industry in the U.S. pays MORE in taxes, either at higher rates or in absolute dollars, than the U.S. oil industry. Go ahead, ask.... the answer will be vague, they'll start talking about lobbyists and cronies. They won't have an answer because the fact is they are merely parroting the media hype. Don't be a parrot.

By the same token, don't listen to me either...do your own research and come to your own conclusion. The only way we have a good democracy is through an educated populace.

Labels: , , , ,

Thursday, March 29, 2012

Switching from Coal to Natural Gas: Will It Impact Natural Gas Prices Near Term?

With historically low natural gas prices today, the argument continues to go that low prices will self-correct. My prior post "Explaining the Disparity Between Oil and Natural Gas Prices" discussed the supply side of things and why gas prices won't rise simply due to price-based changes in supply.

Most industry professionals and natural gas producers will tell you that they themselves only see prices rising once we have a significant demand response to low prices. My prior post discussed some of the reasons that fuel switching was no longer as big a deal as it may have been historically. But the main long-term demand response (fuel switching) that can, and will occur, is the displacement of coal fired electric generation capacity with natural gas fired capacity. This is nothing new. It was the standard future view back in the late 1990's early 2000's when gas was last at this low price range of $2-$3/MCF (mmbtu). But, when gas demand outpaced supply, prices went up in the 2003-2008 period and the conversations all started to shift to renewable energy (solar, wind). Now with low gas prices and ample supply we are again back to gas as a "bridge" (albeit a long one) to a more renewable future. The question then becomes whether switching to gas from coal will have a significant near-term 1-3 year impact on natural gas prices. I will contend the answer is no.

First note that moving to gas from coal is not really "fuel switching" - that is, the power producer doesn't just change the fuel in the plant, they build a new natural gas plant and retire or reduce the use of the old coal plant. For this reason, it doesn't happen quickly and therefore doesn't have a rapid-demand-response impact on pricing.

So let's take a look at how much additional gas demand might come from the current plans for building new plants and how much might come with a big push to retire old coal plants.

First off, here is a chart that shows the existing electric generation capacity in the United States, by fuel type. All data is from the Energy Information Administration (www.eia.gov):


Note that although we have more natural gas capacity than coal, we generate more electricity from coal (see chart below), because those plants are typically "base-load" capacity (run continuously) while many gas plants are used to generate peak power(intermittently turned on to meet peak power needs). The chart below also shows the historic rise in natural gas as part of our mix, and the drop off in coal during the most recent economic downturn. Natural gas has increased through both high and low price environments, because it is a better fuel (cleaner, more efficient). With low prices for the foreseeable future, that market share increase can improve even more. And with potential carbon legislation, gas will be significantly favored over carbon-heavy coal.


Now here is a table showing all the planned electric generation capacity additions (as of Nov 2011) through 2015:


Based on the planned additions, the electric generation mix is not expected to change much through 2015. Natural gas will add 37,718,000 MW of capacity, which is 8.1% growth over the existing 467,214,000 MW of existing capacity. Coal grows 2% while wind grows 39% and solar would grow a whopping 840%. When all is done, however, solar is still less than one percent of all generation, and natural gas only moves from 41% to 41.5% while coal drops from 30.1% to 29%.


So how much more natural gas demand might come from that 8.1% increase in capacity? Well, existing gas demand in 2011 for electric generation was 7,600 Trillion Cubic feet (TCF), or approximately 20.8 BCF per day. Simply, let's assume an 8.1% increase to that, and we'd be using an additional 1.6 BCF per day by 2015. The number would likely be higher, because the new capacity may be more fully utilized than existing capacity, which includes a lot of "peak" plants. So let's assume a number more like 3 BCF per day additional demand from electric generation. That's a meaningful amount of gas, but compare that number to the continued growth in production as discussed in my prior post:


You can see that 3 BCF of additional demand isn't going to make enough of a difference, given that we are producing 10 BCF more each day than we were just a few years ago.

The holy grail of changes to gas demand would come from retiring much of our aging coal plants infrastructure with gas plants. Below is a "heat map" from Platt's (McGraw-Hill) showing that much of our existing coal capacity is from plants over 40 years old.


If we retired a quarter of the oldest plants in the U.S., and replaced them with gas at a level that represented about 10% of our electricity mix, that would likely increase gas demand by an aggregate of close to 10 BCF. That would have a meaningful impact on gas prices, and would generate a significant improvement in our emissions profile. But even with a move up in prices, let's say back to a normalized $6/MCF, gas prices are still attractive to the power generator(demand). They also then become more attractive to the gas producer (supply), and we would see even more supply being developed. So we shouldn't fear higher gas prices...that is what would make the move to natural gas a sustainable one.

How soon can we make a move like this? I contend not in the 1-3 year time frame. But to some extent that is dependent upon how much of the excess gas plant "peaker" capacity could be re-purposed for baseline usage and how much new capacity would have to get built - starting right now.

Labels: , , , , , ,

Thursday, March 08, 2012

Explaining the Disparity Between Oil and Natural Gas Prices in the U.S.

My good friend Ray Conley at Creekstone Capital pointed out the continuing divergence of the market prices of crude oil and natural gas. Being a brilliant math guy and investment guru, Ray knows that statistical aberrations rarely last long and typically are subject to mean reversion. In the case of oil and gas prices, there should be, in the long term, some energy equivalency that keeps their respective prices from continuing on a divergent path. I agree with Ray, in the long term, but I also discussed with him some of the factors that can (not necessarily will) keep the price of oil and natural gas at an "unnaturally" wide spread.


None of this discussion will sound unfamiliar to most hard-core energy guys, but for the sake of other readers, I will just point out a few well known factors driving the oil and gas business right now. I start out by cautioning against the assumption that the price spread shown in the chart above MUST revert to the mean in any short period of time. No doubt there is an argument for energy equivalence: that each commodity is merely used to produce energy and they are therefore "substitutes" from an economist's point of view. But that economist perception ignores some key differences, which are becoming more prevalent.

First of all, to point out the most obvious factor, crude oil is used to make gasoline and diesel and is primarily tied to the transportation needs of the world. There are other marginal uses to produce power and heat (fuel oil) but these are relatively small markets. Natural gas, on the other hand, is not used for transportation fuel - it is used to generate electric power, for residential use (heating, hot water, etc), and as a feedstock for industrial purposes (plastics, chemicals, etc).

About 10 years ago, there were more industries where the two fuels were, at the margin, substitutes for each other. They were/are substitutes mainly in industrial applications where firms can switch their dual-fuel boilers between the two, and for some power producers that could burn either fuel in a power plant.

Historically, that was a big deal when 1) there was less natural gas supply, and 2) industrial use was a bigger part of gas demand. That isn't the case anymore, highlighted by these charts from Nader Masarweh and the California State University - Sacramento Energy Research blog , shown below. Note that there is more total natural gas now (a great deal more), that supply has grown dramatically faster than demand, and that the power sector has become the more important (larger) user. The power sector is a more "sticky" user that doesn't switch fuels based on price, so price divergence between natural gas and crude oil takes on less meaning in today's world. Take a look and then read on below...


Further, I would argue that any fuel switching based on price may have occurred already, based on the divergence of price over the last 2 years. Once all the switchers had done so, the two prices are free to diverge even more so as they would no longer be tied.

And, in the end, crude oil is a transportation fuel that has its own demand and supply curves. And Nat gas is a power fuel that also has its own supply and demand curves. Each will likely work independently to ultimately get the differential to close the existing gap, but not because it MUST, just because crude oil is high and forces are working on demand and supply and because gas is cheap and forces are working there, too. However, those are long term movements. The power sector will continue to increase their use of gas because it is cheap, clean, and plentiful. Many coal plants will be replaced. It could take years before the demand catches up to our new gas supply capacity. Every gas company I talk to has years of wells in inventory they can drill quickly if and when prices rebound, so although low prices are certainly already working marginally on the supply side, we have gotten so good at creating new gas wells at low cost that supply can expand fairly easily if prices start to rise again. I believe it will take a large push on the demand side to really pull gas up hard. That will take years for the long-term balance....or a severe winter where we strain our short-term capacity and drain existing storage.

Another reason many companies continue to produce gas is because they are producing natural gas liquids with it. The value of the liquids stream (propane, ethane, etc) is tied closer to oil prices or to other industrial / chemical demand (as in ethane). These companies will point out that even when their dry gas is just $3.00, the overall value of an mcf of gas includes the liquids that also get extracted, so they really get more like $5 per mcf produced. That is why they keep producing. The same goes for oil drillers in places like the Bakken, they are getting gas as a by-product, and starting to now sell it rather than flare it. A good Bakken well can put off 1-2 million cf of gas a day (2000 mcf). That is the equivalent of a good Marcellus shale gas well with a drill cost of $2mm...and the Bakken guys are getting it for free. With 200 rigs in the Bakken drilling 6 or more wells each a year, that alone would bring on enough gas to replace the 100 gas rigs that might drop out this year.

Meanwhile, companies like Chevron and Exxon continue to increase their production of natural gas, in part because they are learning to improve their shale gas techniques here in the U.S. in order to then transfer their knowledge to international locations where natural gas is very much in need, and selling at far higher prices. The gas market used to be dominated by the independent producers, who ramped up and slowed down drilling very quickly based on price changes. But you can bet the big guys react differently, and far more slowly, to price signals. Another reason gas prices won't revert as quickly in today's world.

So, will the chart revert to the mean? Probably, but it may take time. And the "new mean" may be something very different than the old mean...if you will allow me to play a bit loose with those definitions ;-) And when that happens, I believe we will more likely see crude oil come down, not gas come up. In 2008, I pointed out that we had finally turned the corner on gas production, and my investments started to avoid gas that summer added natural gas puts to take advantage of gas price drops. What I see now in oil is similar - we are creating more new oil supply than ever here in the U.S., and the technology is improving. The difference is that worldwide oil demand is something I continue to see growing, and I believe the new oil right now in the U.S. must replace all the dwindling supplies elsewhere (OPEC and Mexico, North Sea). I think this means we are still in an $85+ oil world, with spikes above that, and that U.S. production will grow, international demand will grow, and the U.S. will become less of an importer, at least in the next 4-5 years. This will dramatically help our trade deficit and I think it bodes quite well for our U.S. economy. The caution I advise, though, is that oil from formations like the Bakken, Eagle Ford, and Niobrara, may be more rare than the natural gas shale plays that have created an oversupply situation. A subject for another day: natural gas is actually being produced out of shale formations, while Bakken oil is actually being produced out of tight formations that are sandwiched between shale formations. Then there is another type of play whereby you "cook" oily shale, which is a different process altogether. Another day, perhaps...

Labels: , , ,

Thursday, January 26, 2012

Honest Data on Tax Rates Paid by Millionaires

OK, this isn't technically an energy topic, but...I am bothered by the way certain politicians mis-use tax data to attack "the wealthy", the latest target being Mitt Romney after his recent tax and income self-disclosures. President Obama recently said that he's not inciting "class warfare", he just wants millionaire's to "pay their fair share" of taxes and doesn't believe guys like Warren Buffet should have a lower tax rate than their secretaries. So, first off, let's recognize that neither Buffet's taxes, nor Romney's, represent the situation for most other wealthy tax-payers, and his secretary's pay isn't likely to bear much resemblance to the "average" middle class worker.

Secondly, let's work with real data, provided by the IRS, the most recent available is from 2009 tax year. Presented at the bottom of this post is a summary of all Federal Income Taxes paid by individuals in the U.S. for 2009 (click on the image to enlarge it so you can read the data). A few observations:

Out of 140.5 Million tax returns filed, there were only 236,883 tax returns in the U.S. with Adjusted Gross Income (before any deductions, exemptions, or credits) in excess of $1,000,000. That is roughly the population of Lincoln Nebraska or Fort Wayne Indiana.

Those 236,883 taxpayers represent just 0.2% (one fifth of one percent) of the taxpaying population, and they paid $177 BILLION of the $865 Billion in taxes collected by the IRS. That is 20.5% of all the taxes paid by individuals. After all deductions and exemptions, 86.2% of their AGI income was taxable, and the $177 Billion in taxes is 24.4% of the $726 Billion they earned. So, while Mitt Romney and Warren Buffet may have pad an effective tax rate of 14%, that is not the case for the average million-plus earning household, which paid at an average rate of 24.4% in 2009.

Go through the table data and notice the rate at which each income level pays taxes. Note things like the people at $1 - $1.5 million paying on average $303,026 to the IRS. Some in politics would have you believe these people get some great tax breaks...but note that same group has taxable income of $111 billion on AGI of $130 billion, so they are paying on 86% of their earnings. The same holds true for all earners above that level until you see a small break at the $10 million and above level (paying an effective tax rate of 22%, due no doubt in part to 15% tax rates on capital gains and certain dividends). So much for tax breaks!! Only 14% of their income gets shielded by any deductions at all.

The middle class, incomes between $50K and $1 million, comprise 33.7% of all tax returns filed, and they paid $627 BILLION in taxes on $5.2 TRILLION dollars in AGI, for an effective tax rate of 12.1%, what appears to be a reasonable rate. The rest of the country (the under $50K in income) pays only 7% of all taxes. Appropriately fair again, in my view...we should not be taxing low wage earners while also supporting with government programs....that is counter-productive. So, 93% of all taxes are paid by earners over $50K, including the highest million-plus earners, while the average tax rate under $50K is 3.5%, after deductions, exemptions, etc.

So, the millionaires are paying at twice the rate (24.4%) of the average middle class worker (12.1%) and seven times the rate of low-income earners. Those 236,883 taxpaying "millionaires" earned an average of $3.1 million in adjusted Gross Income and paid and average of $749,315 in Federal Taxes in 2009.

At a 24.4% effective rate, are the million-plus crowd paying their "fair share"? I would say so. Can they pay more? Maybe, but that isn't the argument made by politicians. If they want to raise taxes on the rich, maybe they should just do so and just call it what it is. This is why President Obama's statements are seen as "class warfare", because they manipulate data to make it sound as if the "rich" are getting away with something. Instead of creating divisiveness among our population, why don't you celebrate the successful, recognize their contribution, and then ask (ok, mandate) for more taxes to be paid. At least they wouldn't feel demonized while also being taxed at high rates.

Last point: given the proposal to increase the effective minimum tax rate to 30% for all income over $1 million, we should ask ourselves what results from that increase. If we take the aggregate taxable income for that group ($626.5 Billion) and increase the rate from the 24.4% they already pay to 30%, that increases total taxes collected (based on 2009 data) from $177 Billion to $218 Billion, a meaningful $40 Billion, or 23% increase in tax collections. For those 236,883 taxpayers, it's another $171,279 in annual taxes on their $3.1 million in AGI.

But wait: $40 Billion is meaningful to the overall individual taxes raised, but what about relative to our annual budget deficit? In fiscal 2010, the U.S. deficit was $1.7 TRILLION dollars (and growing). That is just one year's shortfall of expenses over income. So, $40 billion more would not even knock our annual deficit down to the next round number of $1.6 Trillion. Our problem isn't Federal income, it's Federal spending. Taken to the extreme, you can see that taxing million+ earners at 100% rate (that is, taking their entire $726.9 billion in AGI from them), still wouldn't even cut our annual deficit in half. We cannot tax our way out of this issue based on higher RATES of taxation. We need the entire economy to grow so that the rates we now charge are applied against a larger base. Politicians need to stop fanning the flames of discontent and instead should focus on what we need in this country: jobs, entrepreneurship, and growth.

Labels: , , , , ,

Thursday, October 20, 2011

My Solar output has been staying fairly steady this year compared to 2010. My total solar output in 2010 was 9724 kwh or 26.64 kwh/day on average. Total electric usage on top of the Solar production is about 30 kwh per day in both 2010 and 2011. Given that my marginal rates for electricity above 30 kwh a day are $0.30 to $0.40 a kwh, I am saving about $3500 a year on my electricity bill. Given the net cost of my 7.3 KW system after incentives, my system will pay off in 9 years or less (less under the assumption that marginal rates will rise in future years).

My monthly 2010 solar electricity output looked like this (Jan was just a half month as that was when the system was turned on):


My monthly 2011 solar electricity output looked like this

Tuesday, October 18, 2011

Why I look for 200% Reserve Replacement in an E&P Investment

One of the key things I have always looked for when evaluating an investment in an oil and gas exploration and production (E&P) company, is the ability to economically replace reserves at a rate of over 200% of annual production. That is, for every barrel a company produces, I want to be able to see that the cash flow generated from that production allows them to go find and replace that barrel with two more barrels (2 new barrels replacing one produced = 200% reserve replacement). Doing so with internally generated cash flow allows a company to grow reserves at a reasonable rate, benchmarking around 10%, without raising capital and diluting investors. Why, you may ask, does it take a 200% reserve replacement ratio to grow reserves just 10% annually? Some of you already know the answer, but let's run through an example.

Let me start with the simple example I've shared over the years. I'm simplifying here, but if you are a producer that can find a barrel (Bbl) of oil for $20, produce it for $10 and sell it for $50, you'd be pretty happy. This mathematical model allows for growth in reserves and production and a positive return on capital. First you should recall that an E&P company needs to at least replace each unit of oil it produces with a like unit, otherwise it is just depleting away it's existing asset base. Therefore, the sale of each unit must generate enough excess cash flow to go replace that unit at a cost equal or below that excess cash flow. Let's say your operating metrics look something like this:

1) Drilling and completion cost of your latest well: $6,000,000
2) Size of new reserve from this well: 300,000 Bbls
3) Finding cost per Bbl: $6,000,000 / 300,000 = $20.00 per Bbl
4) Producing life (expected reserve life) of well: 10 years (note that production is not linear, that it comes on at the highest rate it will acheive and will decline over time due to reservoir and pressure depletion)
5) Lease Operating Cost per unit (to flow it from well, maintain well ops, etc): $10.00 per Bbl
6) Sale price per Bbl: $50.00

Therefore, each unit produced will generate cash flow of $50.00 minus $10.00 in lease operating costs, or $40.00 per unit. But now you have depleted your asset base by 1 barrel, so what do you do? You take your $40.00 in cash flow and go invest it into a new drilling program. Since your finding costs are $20.00 per Bbl for a 300,000 Bbl well (assuming here you have a repeatable drilling program), you have the ability to replace your one unit produced with two more. Note that another way to look at it is that the $50 -$10 - $20 finding costs gives you excess of $20 which is "full cycle" free cash flow that allows you to create one new barrel through drilling. So don't be fooled by the $50 - $10 calculation, at first glance you might imagine I was ignoring finding costs. Full Cycle cash flow must be no less than zero to stay flat in reserves, or be positive to grow the company.

This is essentially how you grow the company. In this case above, your company would have the ability to replace reserves on a 2-to-1 basis. But note that producing one actual Bbl doesn't actually get you two because you don't drill wells that are just two Bbls in size. In the absence of borrowing money to drill, you actually need to produce enough of your existing reserve to get the money to drill the next well. In this case, you'd have to produce 150,000 Bbls (half your expected reserves for that well) before you had enough money to drill your next $6MM well…this might take a couple years. The sooner you get your cash back, the sooner you can drill your next well. This is why the first months and first year of production is important.

So let's assume you have 3 million barrel (3MM Bbls) of total reserves at the beginning of the example. You spent $60MM to develop those reserves and have total finding costs of $20.00 per Bbl, which are on your balance sheet as an asset. Your average reserve life is about 10 years, and for simplicity, lets say you are producing 300,000 Bbls each year (this assumes linear production and no decline but is not relevant for the example). You are therefore generating $40/Bbl in cash flow times 300,000 Bbls for $12,000,000 per year. You can use that to drill 2 new wells at $6MM each and come up with another 600,000 Bbls of new reserves. This would be considered a 200% reserve replacement ratio (600,000 Bbls new / 300,000 Bbls produced). But although you replaced 200% of what you produced, your underlying reserve base grew by just 10%:

3,000,000 Bbls beginning reserves
- 300,000 Bbls produced
+ 600,000 Bbls found
= 3,300,000 BBls ending reserves.

In this case, you grew your company's reserve base by 10% annually by achieving a 200% replacement ratio on production.

Of course, if you have a bad year and you spend $12MM in drilling costs and only find 300,000 Bbls of oil you find that your reserves did not grow at all. This is essentially the position many of the larger integrated companies find themselves in: it is very hard to grow reserves once you get to a certain size. The big guys tend to just replace production at a 100% rate, give or take a few percent. Those are not growth companies. Also note that industry-wide finding costs are likely to be in the $15-$20/Bbl range these days and anyone who can improve on that has a big growth advantage.

So…using the FASB 69 supplemental disclosures at the back of every public E&P 10-K:

1) look at annual finding costs (total capital expenditures for drilling / total change in reserves, adjusted for prior period changes)
2) Calculate operational cash flow per barrel produced (Rev - Op Cost) and full-cycle cash flow (Rev - Op Cost - Finding Cost). Compare Op Cash flow to Avg Finding Costs to determine CF per Bbl
3) Look at total reserve replacement (total new reserves / total production)
4) Compare across companies and over rolling 5-year periods (one year isn't a fair assessment period for a growing E&P company) and you will find significant differences that can lead you to asking the right questions about a company's value and ability to grow. Of course, history doesn't predict the future, but positive trends in a company's costs over time should tell you something about the type of reserves the company is chasing and how they are managing their growth. Consistent reserve replacement should be a sign of strength while highly volatile results may be cause for further investigation.

There are many nuances to these calculations which I won't go into here (for example, how to factor in annual reserve adjustments based on price changes and vs. technical reassessments, and the amount of PUD - Proven Undeveloped - reserves that any given company is booking along with their Proven reserves). Again, this example is intended to cover the basics for now. In a later post, I will show an example of the many inputs and calculations.

But now you should start to get pretty excited about a company that has finding costs of $10/Bbl, operating costs of $10/Bbl and is selling oil at $75+ per barrel. You will realize that the ability to grow reserves quickly and economically goes up exponentially when you have all the right cost structures and the ability to repeat drilling success in a given area. For those of you new to this, that is what the industry refers to a "resource" play…an area that has a known resource that can be accessed with existing techniques to result in known well outcomes that cluster around a statistical mean. Hence, the value of a Bakken oil well that I discussed in my earlier post becomes more important when repeatable with known economics. At the end of this year, when 10-Ks come out in April with audited reserve numbers, I believe we will see tremendous reserve growth in the Bakken players, with exceptional finding cost results and industry-leading economics.

Labels: ,